Crop-yield-prediction-using-weather-data-and-NDVI-time-series
The proposed system will be able to predict the crop yield production which will be useful to farmers for harvesting and storage. The system will use the weather forecasting which includes the parameters like temperature, rainfall, humidity, dew point and the normalized difference vegetation index time series from Sentinel-2 satellite for selected region. By using both the results obtained,accurate crop yield prediction can be calculated which will help farmers in planning efficiently, minimize costs and maximize yields—and profits—as a result.
What is NDVI ? The Normalized Difference Vegetation Index is a simple indicator that indicates the green areas in the specified region. The NDVI is analyzed using the remote sensing measurements which are captured from the space platform. The calculation of NDVI requires the multispectral image from the satellite. The multispectral images contain more than 3 bands which are red, green, blue. The NDVI can be calculated by the simple formula that requires the values of 2 bands red and near infrared. The NDVI value ranges from -1 to +1, where positive values indicate more denser green region while negative values indicate lesser green area.The NDVI for the Sentinel-2 satellite can be calculated after 3-5 days interval and hence the time series can be analysed for the specific region of interest. NDV I = (NIR − Red) (NIR+Red) where, N DV I : Normalize Difference Vegetation Index NIR : Near Infrared
Problem Statement
Previously, the research was based on weather parameters or remote sensing data for crop yield prediction, but combination of both was nominal. MODIS and LANDSAT VII/VIII satellite images were suitable for state/country but not for small scale/regional farm lands.This work propose a novel hybrid approach which combines weather parameters and NDVI values from Sentinel II having spatial resolution of 10m and revisit cycle of 5 days which can provide better accuracy for crop yield prediction in regional farming areas for sustainable development. This approach will predict the yield well ahead of harvesting time using historical crop production, weather and NDVI parameters by applying varied machine learning techniques. The proposed system will be able to predict the crop yield production which will be useful to farmers for harvesting and storage. The system will use the weather forecasting which includes the parameters like temperature, rainfall, humidity, dew point and the normalized difference vegetation index time series from Sentinel-2 satellite for selected region. By using both the results obtained,accurate crop yield prediction can be calculated which will help farmers in planning efficiently, minimize costs and maximize yields—and profits—as a result.
Software Requirements
• Python 3.7 : This is required for basic coding of the different machine learning algorithms and basically required for jupyter notebook. • Jupyter Notebook 6.0 : This is required for the actual preprocessing on raw data, processing on the obtained dataset with different algorithms. Google Earth Engine: This is required to access the satellite images and find the NDVI time series for the previous years of the region of interest. • QGIS 3.10.5 : This is required for GIS Mapping of Maharashtra ESRI shapefiles. • Apache Tomcat 9.0 : The tomcat is a web server used for the host the web gis portal with geoserver. • Geoserver 2.17 : The geoserver is used as GIS server for hosting the shapefiles that can be visualized using web server in portal. • PostgreSQL 9.1 : This is the sql databse used for the storage of the data and the required for the postgis database. • PostGIS 2.2 : This is the geospatial database required to store the co ordinates of the shapefiles with its different attributes for the visualization process.


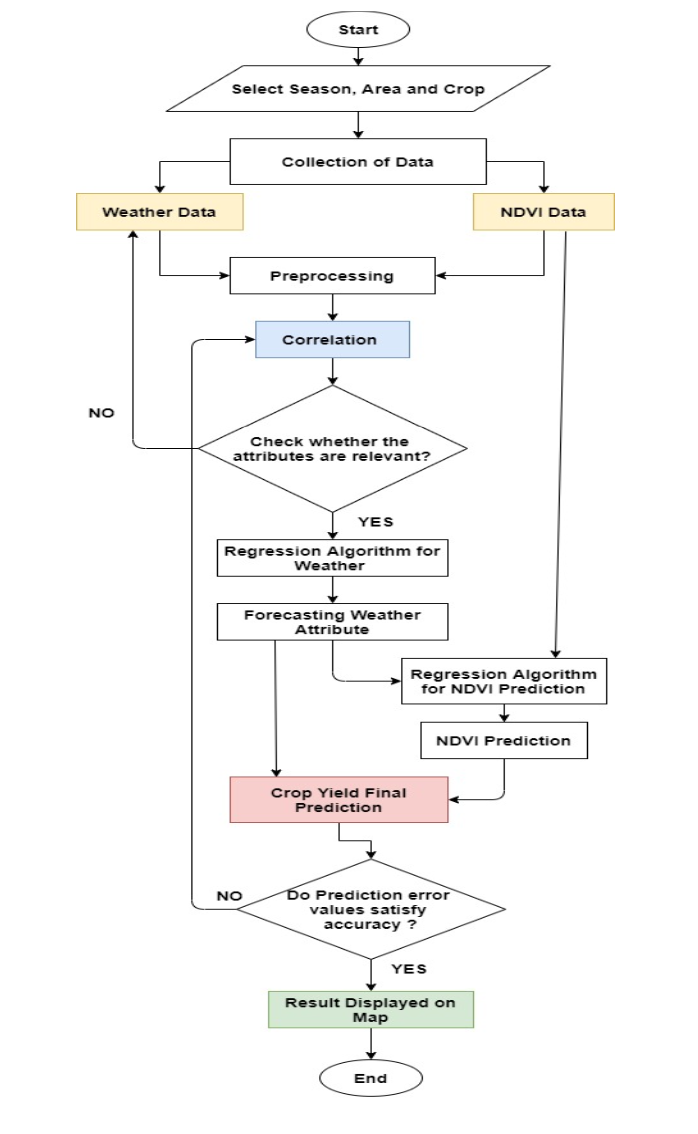
Flowchart for the project:
Dataset used for the Proposed Model
For the machine learning data set is very important factor for the accurate results. In this work, we have focused on the Vidani village which is situated in Phaltan tehsil of Satara district in Maharashtra for the sugarcane crop and the whole Maharashtra region for the rice crop. The Latitude and Longitudinal coordinates for this village are 17.9824° N, 74.5113° E. By using these coordinates we have collected the monthly weather data from NASA POWER for the last 20 years. The precipitation data is collected from the CHRS Data Portal. The soil parameters and historical production data since 2000 for the Satara district were collected from the Ministry of Agriculture and Farmers Welfare department. The NDVI index which ranges from -1 to +1 is collected using earth engine and the satellite used is Sentinel-2. The satellite was launched in 2015 and has a resolution of 10m. The bands which are useful for the NDVI calculation are B4 and B8. They are the red and near infrared bands. The normalized difference is calculated from these two bands and the mean value of the NDVI for each month is calculated using the median() function from the year 2016 to 2019. The following table shows the weather and NDVI parameters used for this work.
Correlation Matrix for sugarcane dataset

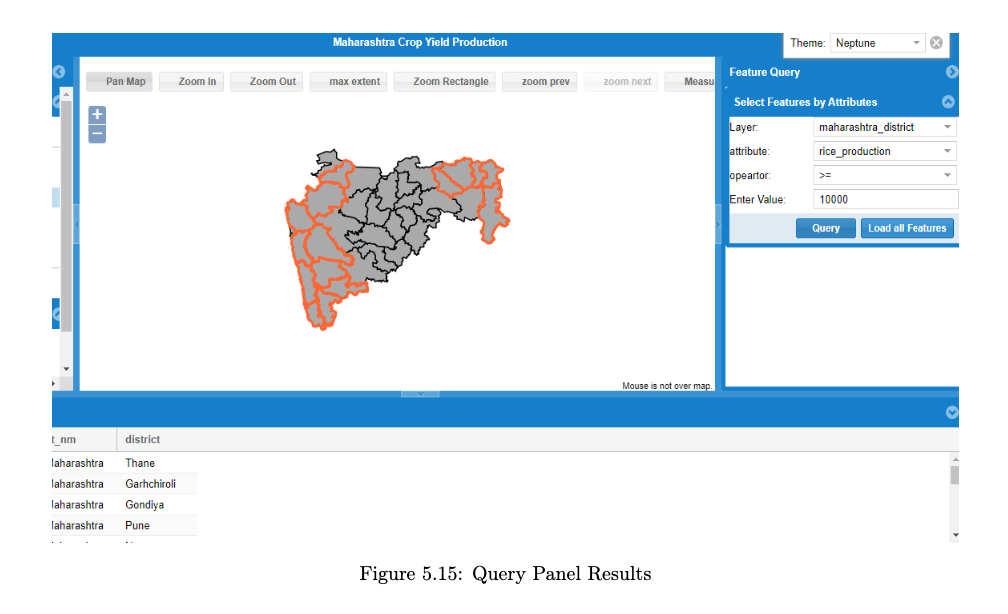
Result Visualtization:
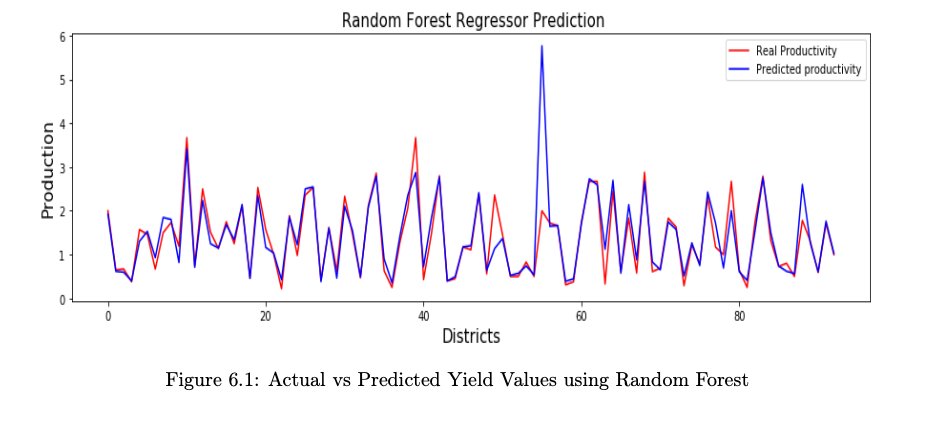
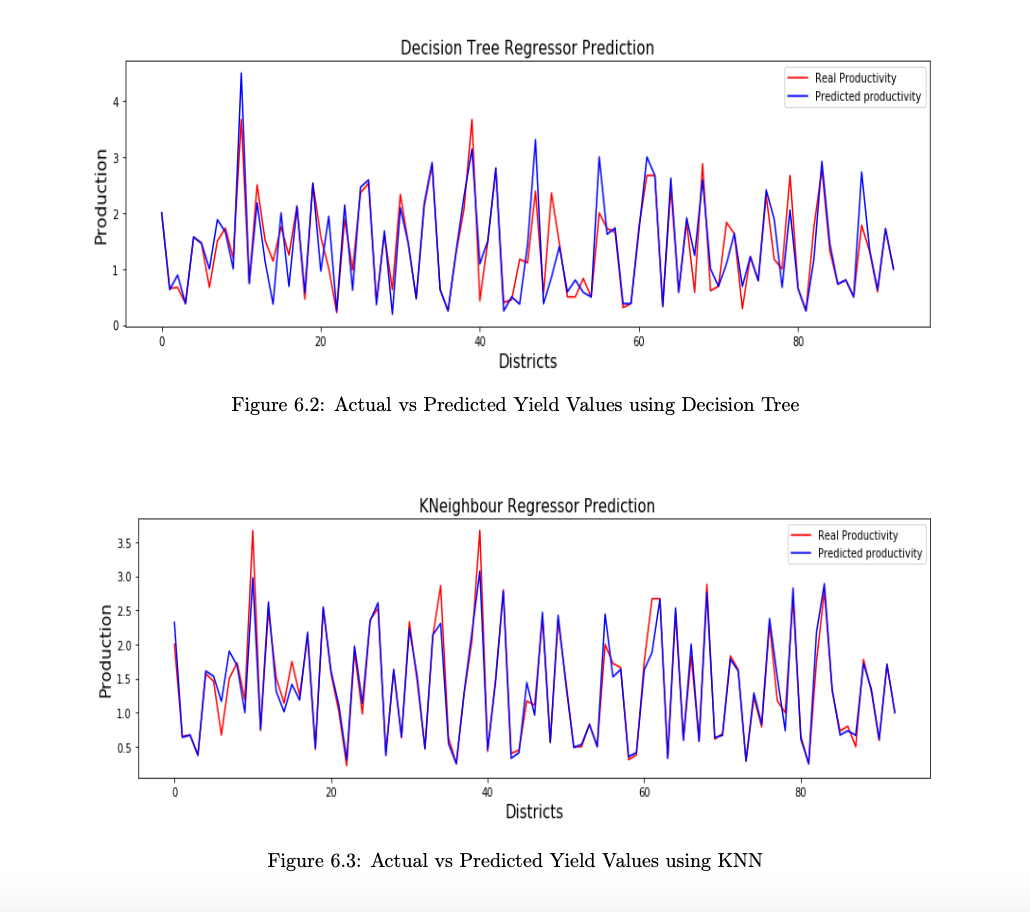
Comparative Result Analysis:

Please feel free to ask me questions on abhiw963@gmail.com Cheers!!